
Last week left absolutely no doubts about the condition of the American Stock Market. Nasdaq made new highs and draw a strong green bullish candle on the weekly chart. As we can also see on a D1 timeframe, last six sessions in a row ended with a green candle, which is the best series since February.
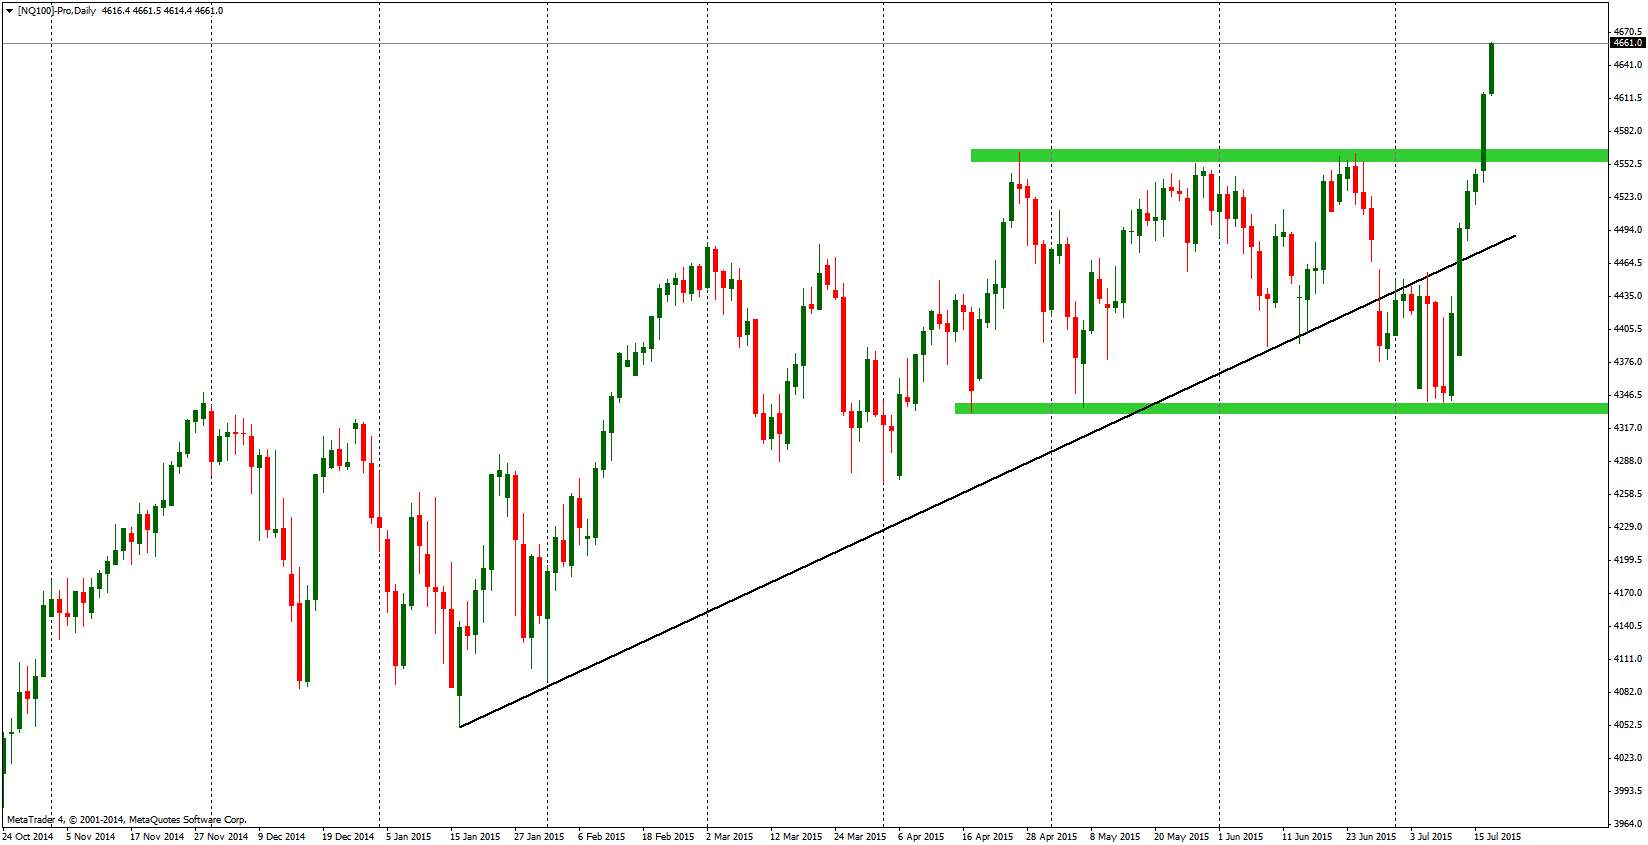
July didn’t start too optimistic. Price managed to break under the mid-term trend line (black) and break lower below the lows from the June. Problems in Greece and China gave a fuel to sell. Not for long though as we all know, Americans are very resistant to the situation abroad. Times were not different now. They managed to defend the crucial mid-term support on the 4340 points (lower green area), which was an ignition for a take off seen now. Price spiked and managed to break the local resistance around the 4560 points, made by recent three local tops (upper green area). Currently, 4560, will be the closest support and we can assume that traders will use the next few days to correct this recent movement and take some profits. 4560 seems like a good place for a bounce and a start of a new upswing.
Surprisingly the next week has no significant events in the macro calendar in the US. We can assume that the Nasdaq will be driven mostly by the situation in Greece, China and the greed itself, which is very widely present on the Wall Street. Current long term signal is only one and it is buy, but obviously the recent movement creates a great occasion for a short-term correction, which should be mainly used for buying the index on the lower, better levels.
No comments yet.